 Loading
Loading
Loading
EasySignup lets you see an overview of where visitors to your registration pages come from. You can also see the percentage of visitors who register for an event.
Find the overview under Account->Statistics in the top of the dashboard.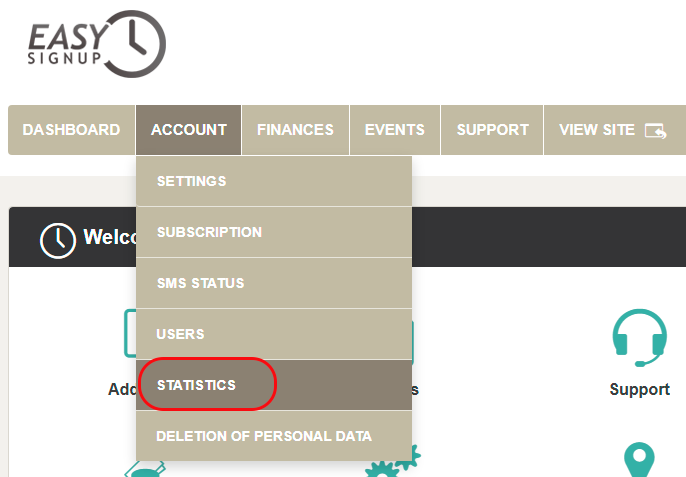
The tab "Traffic and Registrations" lists an overview of the total number of visitors and registrations on the account (e.g. https://showcase.easysignup.com/) (1). You can also see an overview of the individual events (2).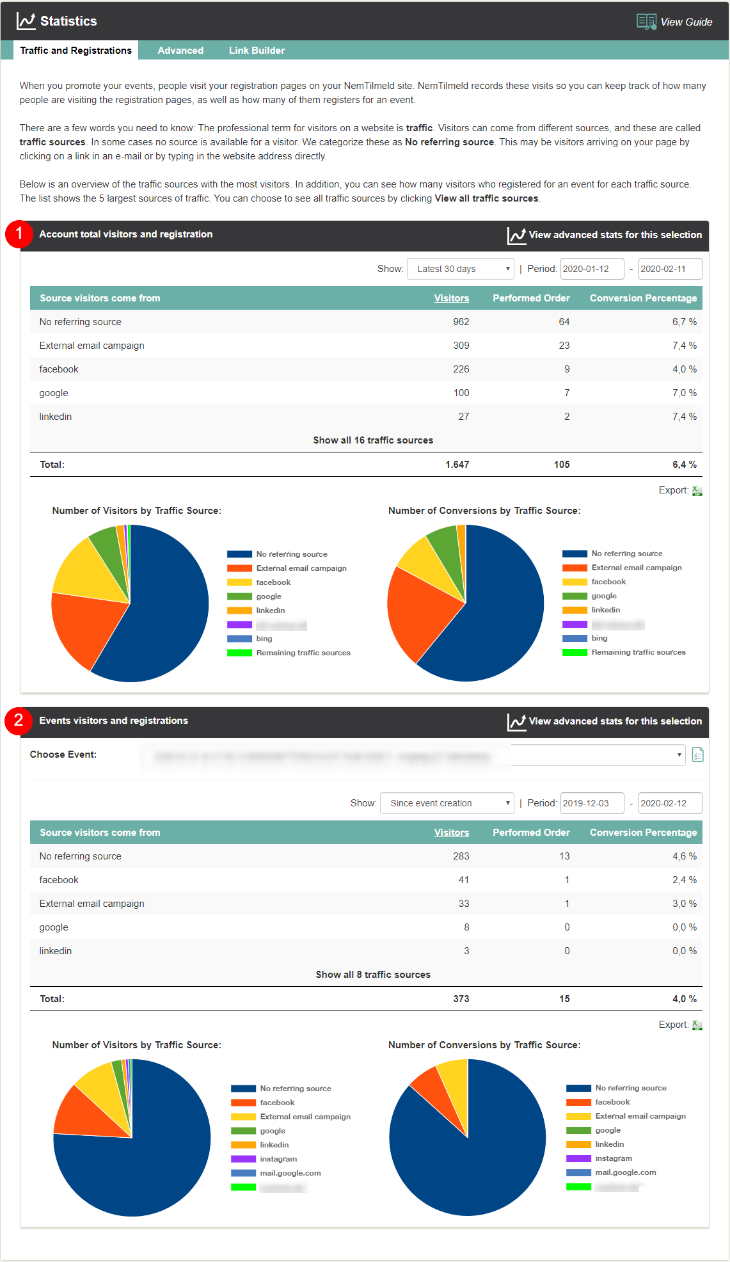
The page gives you insight into (and overview of) where visitors on your account come from - and whether they convert (register). We hope this insight can support your event marketing.
On top of the page is an overview of the total traffic where you can get an overview.
In addition, you can see the number of unique visitors from each traffic source, as well as how many who register (Note: A registration can cover multiple attendees).
Here you can see additional data about the relationship between traffic and UTM parameters if you have set up UTM parameters. See more in this guide.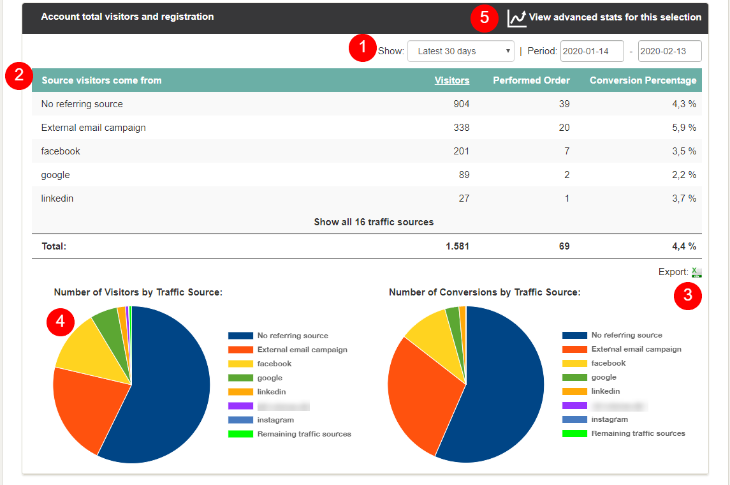
At the bottom of the page, you can find the same information for individual events
In addition, you can see the number of unique visitors from each traffic source, as well as how many who register (Note: A registration can cover multiple attendees).
Here you can see additional data about the relationship between traffic and UTM parameters if you have set up UTM parameters. See more in this guide.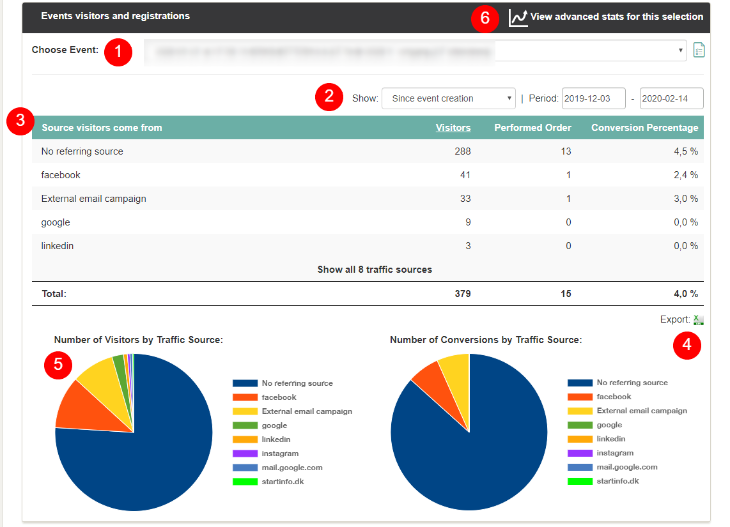
We've made a series of videos showing you how to use EasySignup.
Watch introductory videosWhether you are a participant or an organizer, some of the questions you might have about the IT-system are answered here.
Read the answers
Mette Jellesen and Jacob Thomsen
Support and Communication